This is the time of the month, when Green Dealflow publishes its transaction activity report in the solar and wind industries for October that you can access here. The report is built on our transaction database, which tracks equity transactions of solar and wind projects from around the world and it available for you to have an insight on where the market is going.
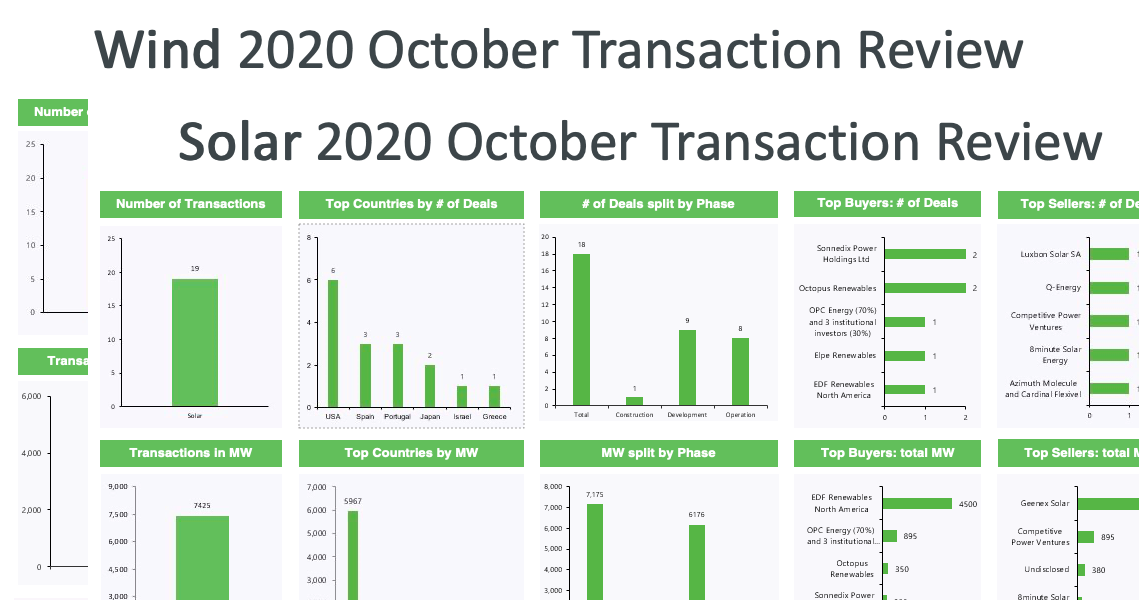
October is a fascinating month, in which the seasons turns and businesses are ready to take the last intensive sprint towards the end of the year, and what a year! Renewables are still on the wave of success and many countries are becoming hotspots in terms of projects, investments but also co-developments among countries. Why do we like to talk abou this? Because we are all projecting a greener future for our societies. The increasing trend can be seen in our analysis this month, with an increase in the number of transactions for the overall market, for example we have a total of 40 transactions tracked, for a total of 11.5 GW, a small increase that signifies a lot during those times. Green energy is here to stay and there is no turning back.
The solar industry´s performance this month is aligned with our expectations, getting a total of 21 deals, with an overall capacity of 7.5GW, going higher and beyond the last month. Among the most active countries, the U.S. remains our top country, leading the way with 6 transactions. European countries are also led by the Green Deal signed by the European Union, which required an overall adjustment to policies. But we can already taste the sweet fruits of these governmental actions, as Spain, Portugal and Greece are among the Top 5 countries. Good job!
Among the several transactions, Sonnedix LTD has expanded its market in Italy, a country close to our company at Green Dealflow, in which the company has reached 244 MW, positioning itself as the leaders of development in this market, expanding their portfolio with 15 new solar plants.
In the wind industry, the 4 GW transacted for 19 deals signer, suggest a slowing down of activities. The wind industry is the one to keep an eye on, thanks to technological development and the adjustments made towards an implementation of the offshore wind industry. The industry is preparing for a big change. In the top 5 countries, the U.S. has been overcome by France in this race. France in fact, was expected to give a boost to wind, especially offshore. Nonetheless, the U.S. does not place itself far from the European leader this month, maintaining its average amount of deals, around 4. New entries in this industry are represented by Brazil, Romania and Poland, the last one being a focus market in Green Dealflow and expanding more every month. The biggest transaction was accomplished by OPC energy: Through a special partnership, OPC Energy will own 70% of the newly formed entity OPC Power interests, in connection with the acquisition of CPV.
This month was full of interesting projects and deals signed, all in the perspective of keeping the green wave crash into the market. Stay updated with our website and looking forward for the next month!
Green Dealflow – is a matchmaker for professional investors and asset owners in the solar and wind industry. You can create a free account and search for assets to invest in, or ask us about off-market projects, find investors for your projects with discretion (off-market), or PPA Off-takers can look for business partners on a “no cure – no pay” basis. Further to this, Green Dealflow delivers news, blog posts and business intelligence, e.g. through a transaction database and monthly reports.


