Researchers at Aarhus University have analyzed three PV setups for the optimal setup for agrivoltaics. Through their comprehensive comparative analysis of sustainable energy and agriculture integration, we explore the optimal PV setup for agrivoltaics in Europe.
Table of Contents
How to sustainably integrate energy and agriculture
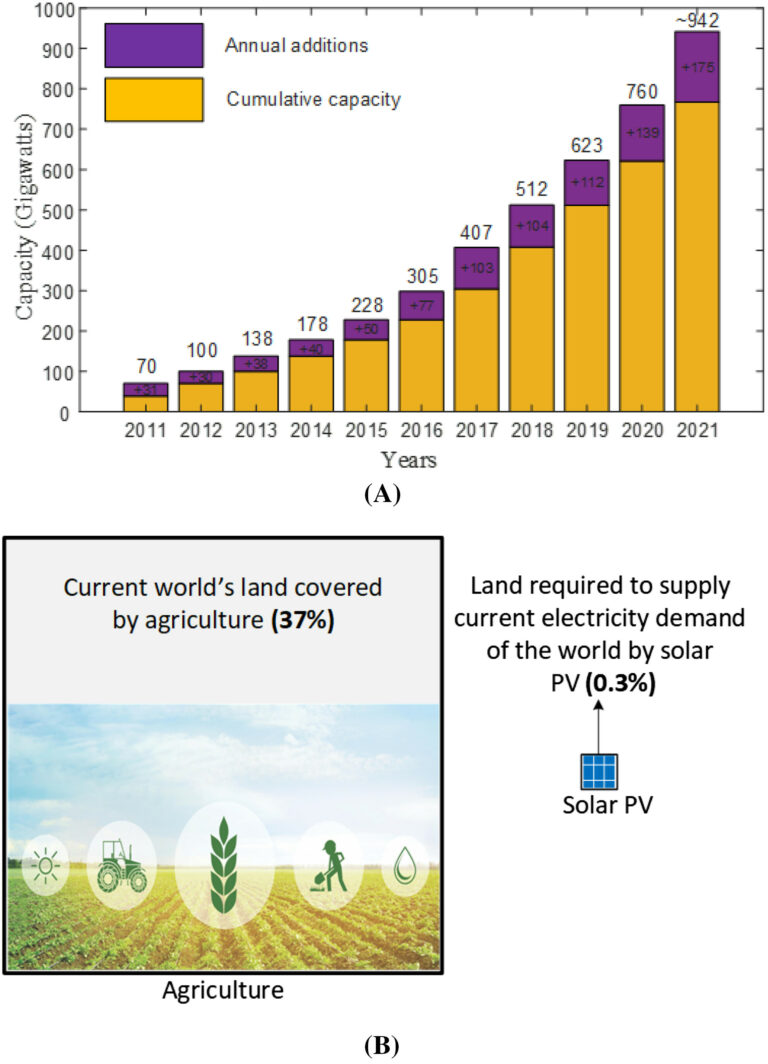
Solar photovoltaics (PV) have experienced rapid global expansion in recent years. It’s boasting a cumulative capacity of 942 GW by 2021 (Figure 1). Despite PV’s potential to cover a fraction of global land for electricity generation, localized land competition and social acceptance issues loom. Concurrently, preserving agricultural land, improving crop yields sustainably, and addressing climate change are pressing agricultural concerns. In this context, the fusion of solar PV systems and agriculture, known as agrivoltaics, presents a mutually beneficial solution to why analyzing optimal PV setup for agrivoltaics is relevant.
With over a decade of experience connecting developers and investors, we dive into the trenches, revealing the most common mistakes developers make that sink renewable energy projects before they even see the light of day.
Figure 1 - Worldwide solar photovoltaic (PV) installed capacity over time. (A) and (B) comparing current agricultural land coverage to the maximum land needed to meet demand.
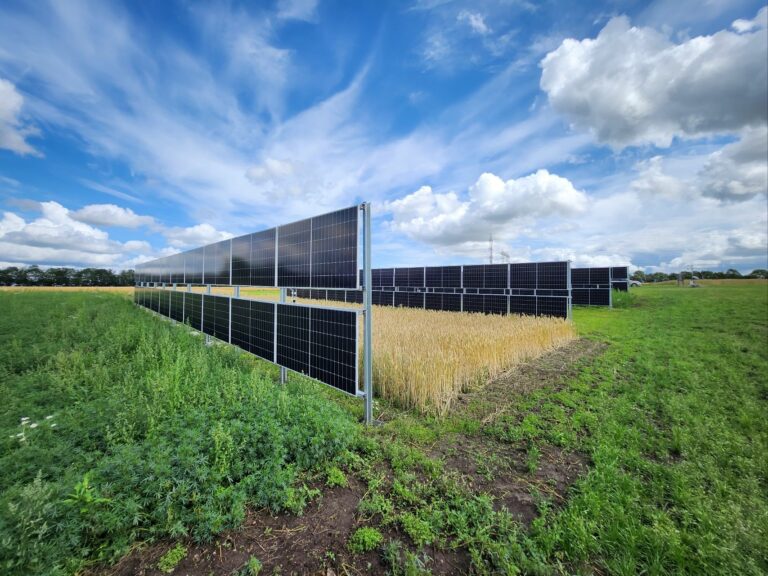
Integrating PV systems and crops can usher in micro-climate shifts, diminishing irrigation needs and enhancing soil conditions in arid environments. Additionally, solar panels can serve as rainwater collectors for irrigation. They can also provide weather protection for crops, and foster a harmonious food-energy alliance. Research has demonstrated varied impacts on crop yields under APV, with certain crops thriving and others experiencing marginal decreases.
Analyzing the potential of APV installations across Europe
This study about optimal PV setup for agrivoltaics delves into the potential of APV installations across Europe. The study highlights the single-axis horizontal tracking setup as the most electricity-generating option when examining three PV configurations across diverse spacing and heights. The analysis extends to gauge PV installations’ influence on agricultural fields and determine APV potential throughout European countries. Ultimately, the research emphasizes APV’s significant capacity to drive sustainable energy generation while coexisting with agricultural imperatives.
Agrivoltaics, the fusion of agriculture and photovoltaic (PV) systems, presents a promising avenue for sustainable land use and energy generation. This study meticulously investigates three agrivoltaic setups: static with optimal tilt, vertically mounted bifacial, and single-axis horizontal tracking configurations. A sophisticated model gauges shadowing losses and diminished solar irradiation across varying PV capacity densities. Initial analysis at a Danish site reveals uniform ground irradiance with vertical and single-axis tracking setups. An optimal capacity density of approximately 30 W/m2 emerges. Extending the study across Europe unveils staggering potential: agrivoltaic systems could generate electricity 25 times the present demand. Europe’s agrivoltaic capacity could surge to 51 TW, yielding a remarkable 71,500 TWh annually. This research elucidates workable agrivoltaic designs and underscores their immense capacity to address energy and agricultural challenges.
Exploring the optimal PV setup for agrivoltaics in three configurations
Investigating various agrivoltaic photovoltaic (APV) configurations, this study focuses on three PV setups. Optimal tilted, horizontal single-axis tracking and vertical bifacial setups (Figure 2A, 2B and 2C). These setups are analysed in detail to elucidate their unique characteristics and design elements.
Optimal tilted PV system
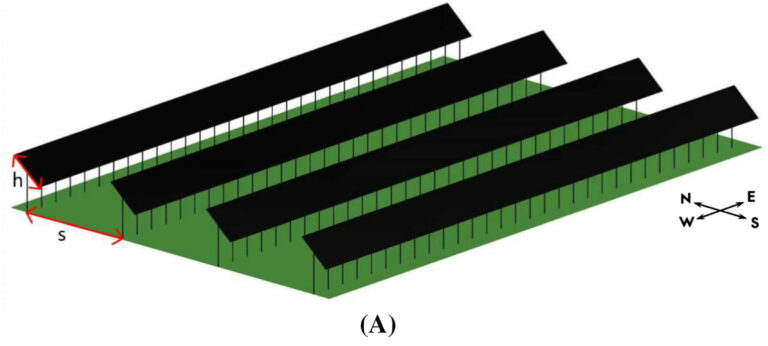
The optimal tilted configuration involves a monofacial fixed-tilt PV system facing south. Notably, the optimal tilt angle adjusts based on latitude to maximize yearly electricity generation, in line with European Commission guidelines. Illustrated in Figure 2A, this design is referred to as the tilted configuration.
Figure 2A - Optimal Tilted PV System.
Horizontal single-axis tracking PV system
In the horizontal single-axis tracking setup, monofacial PV panels are mounted along a north-south axis. They can adjust their tilt angle dynamically throughout the day. Panels orient eastward in the morning, lie flat at noon, and face westward in the evening. Figure 2B provides a schematic illustrating this design at different times, termed the single-axis tracking configuration.
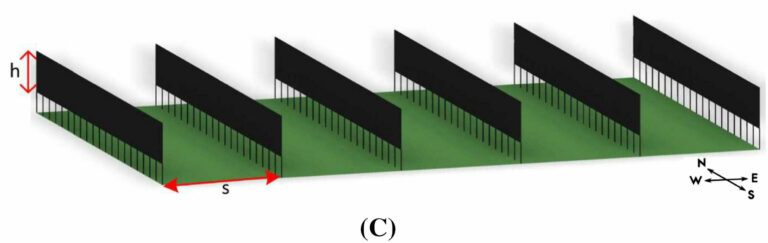
The vertical bifacial configuration places PV modules vertically along a north-south axis. That exposes one side to the east and the other to the west. This setup—referred to as vertical bifacial—assumes a bifaciality factor of 0.8, enhancing its energy capture potential. See Figure 2C below.
Figure 2C - Vertical Bifacial PV System
Agricultural photovoltaic configurations: Electricity, shadows, and potential benefits in Europe
This study investigates three distinct agrivoltaic (APV) setups on a reference field measuring 100 m x 100 m to analyze electricity output and on a 50 m x 50 m field to assess shadow effects on the ground. The choice of field sizes minimizes border errors while maintaining computational feasibility. PV modules are positioned at fixed heights above the ground: 2 m for the tilted setup, 1 m for the single-axis tracking, and vertical bifacial setups. This differentiation arises due to the elevated structure required for the tilted setup’s optimal performance. While the distance above the ground does not impact electricity production, it influences shadow distribution on the ground. Inter-row spacing and PV module height are considered variables in conjunction with installation types.
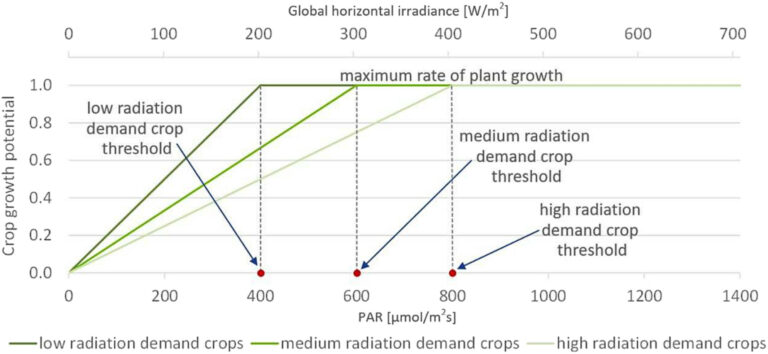
All setups are assumed to use solar panels with similar electrical properties for modeling solar PV generation. The analysis includes irradiance reaching the modules and solar electricity production. Considering different crop radiation demands, the study factors in shadowing effects on the ground and their impact on crops. Performance indicators such as capacity density, electricity yield, price-weighted electricity yield, shadow losses, and specific yield are evaluated in Figure 3.
Figure 3 - Optimal PV setup for agrivoltaics: Modeling shadowing on the ground and impact on crops.
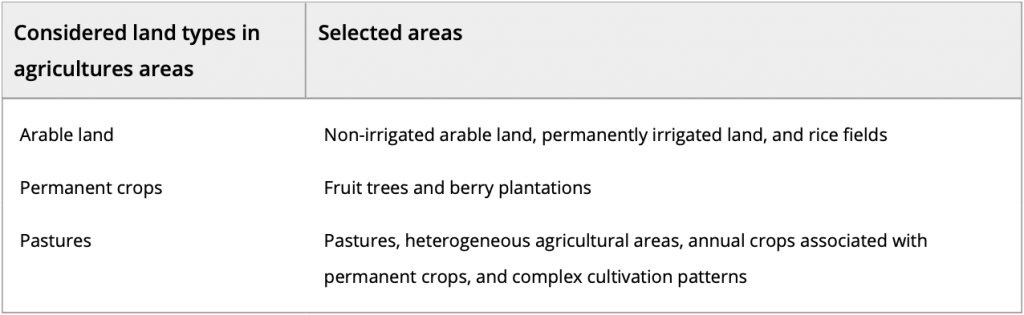
Land availability and maximum electricity generation are assessed to determine the potential of APV systems in Europe (See Table 1 below).
Table 1 - Land types considered for APV systems as per the Corine Land Cover database (with a 100m spatial resolution).
Land eligibility analysis using the Corine Land Cover database identifies suitable land types for APV systems, excluding protected areas. The analysis contributes to understanding APV setups’ viability and potential benefits in different contexts.
The performance and potential of various PV setups in agrivoltaic systems
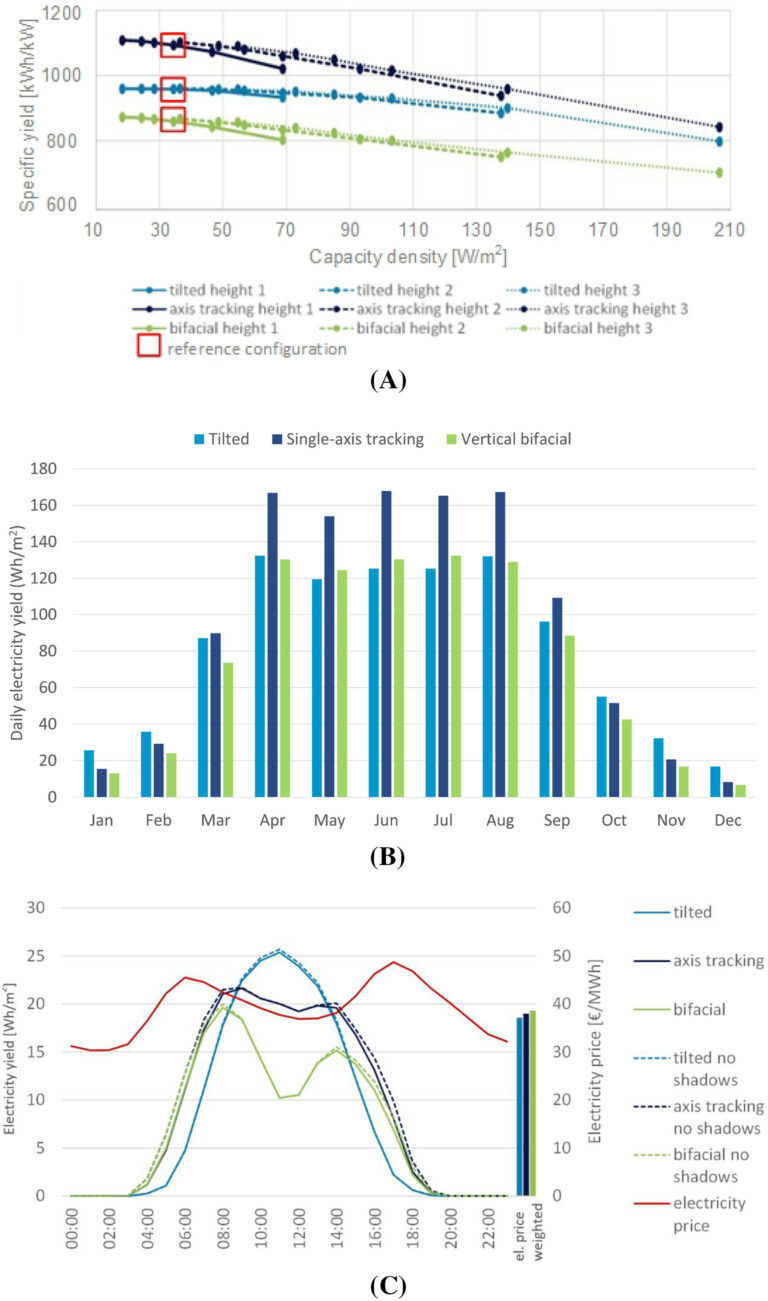
Significant findings emerge in assessing the optimal PV setup for agrivoltaics and the performance of distinct photovoltaic (PV) setups at a low-irradiance northern location (Foulum, Denmark). The figure below, (4A) illustrates the specific yield for different configurations, factoring in shadow losses. The average daily electricity yield for each month is analyzed in (4B). Daily generation profiles vary, especially in Denmark due to electricity price fluctuations, causing a midday dip shown in (4C). Vertical bifacial setups align better with price profiles, yielding more price-weighted electricity despite lower overall output.
Figure 4 - System evaluation for a Northern location with low irradiance values.
The single-axis tracking setup yields the highest, followed by tilted and vertical bifacial setups. Notably, the tilted setup maintains a consistent specific yield until a capacity density of around 70 W/m², while the others decrease at lower densities. Shadow losses remain minimal at the lowest capacity density (15 W/m²) for all configurations.
Spacing and heights for the optimal PV setup for agrivoltaics
Analyzing varying heights within a setup and considering inter-row spacing, it’s observed that increased height enhances electricity generation, while greater spacing diminishes generation. Irregularities are attributed to shadow effects. The analysis of temporal generation patterns shows summer yielding higher electricity production than winter. Tilted setups outperform others in winter, while single-axis tracking excels in summer.
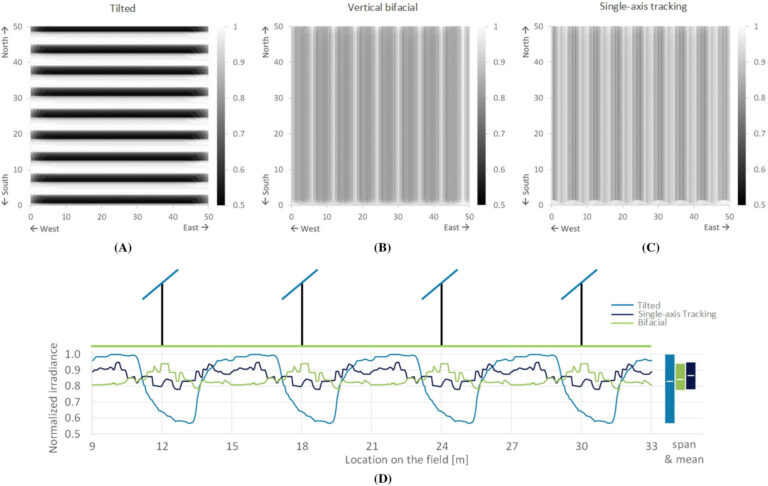
The assessment extends to irradiance distribution on the ground in (5). Vertical bifacial demonstrates even shadows and irradiance distribution, unlike the tilted configuration with more pronounced shading
Figure 5 - Incorporating ground shadowing in July for the reference site in Foulum, Denmark. (A) static optimal tilt, (B) vertical mounting, and (C) single-axis horizontal tracking setups.
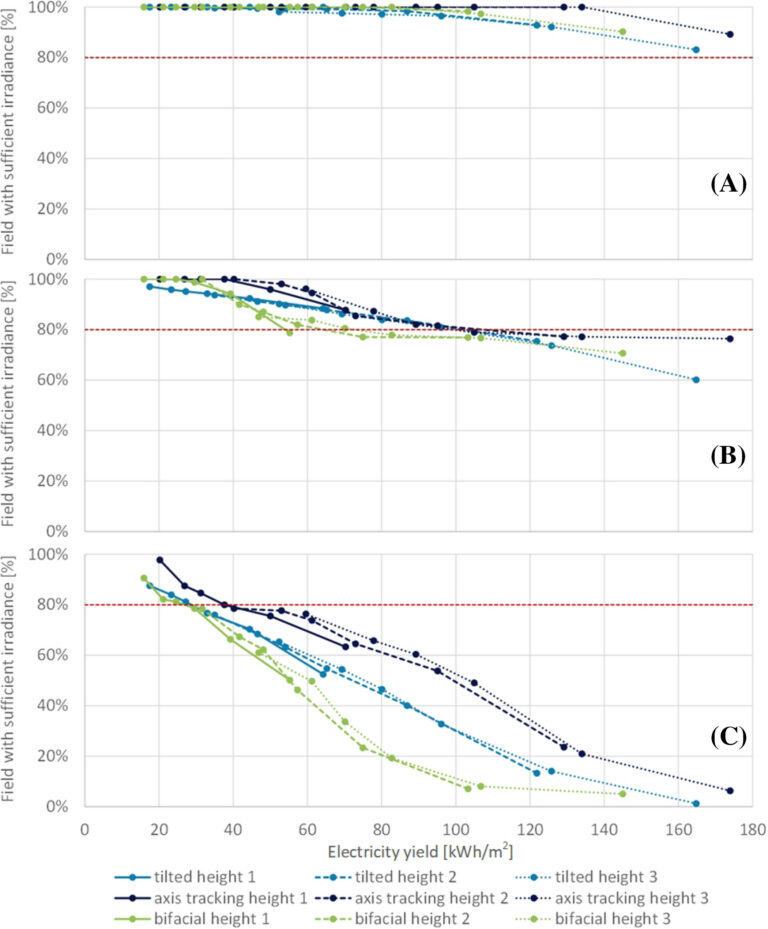
Figure 6 presents a chart depicting the proportion of the field with adequate irradiance for crops relative to electricity yield. A decision map to prioritize: crop production (upper left corner). Electricity generation (lower right corner). Or strike a balance between the two.
Figure 6 - Graphing crop-friendly land percentage against annual electricity yield (kWh/m2) for the three configurations in Figure 2. Specifically for Foulum, Denmark.
Looking into the optimal PV setup for agrivoltaics in Europe
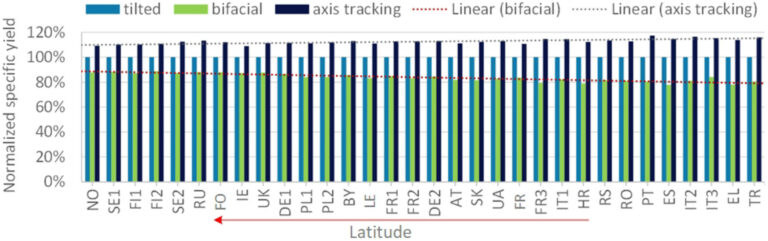
When expanding the analysis to Europe, we see the yearly electricity output rises as latitude decreases in all three cases. With axis tracking leading, followed by tilted, and vertical bifacial setups, the sequence remains consistent across all locations. Moreover, we explore whether these relative differences hold true regardless of location. To investigate, we normalize the specific yield for each setup relative to the tilted configuration in its respective location. Illustrated in Figure 7.
Figure 7 - Normalized annual energy yield in various locations (normalized based on the tilted configuration).
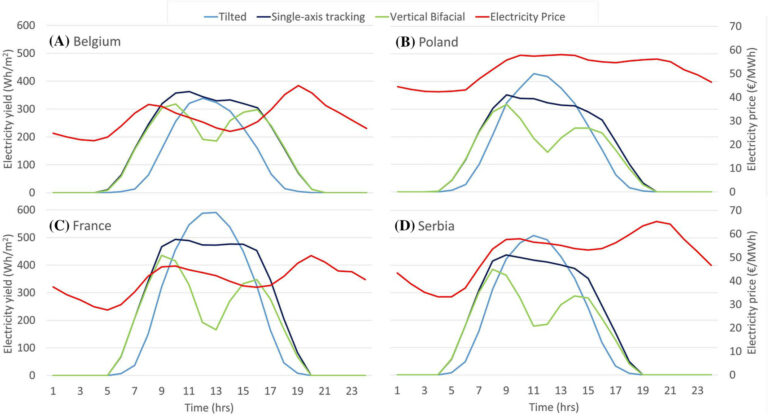
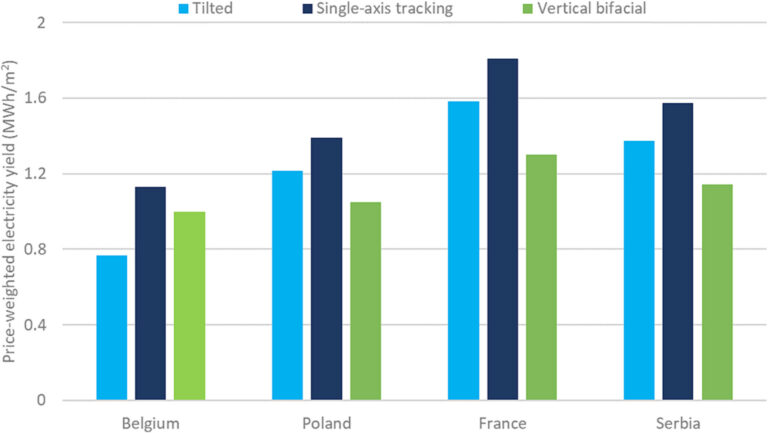
Figure 8 extends Figure 4 to various European countries. Latitude subtly alters the daily generation profiles for the three configurations. But it’s the unique daily evolution of spot market electricity prices, influenced by demand patterns and renewable penetration, that stands out in each country. Across the board, the tracking configuration consistently achieves the highest electricity yield. However, depending on the specific country, either the tilted or bifacial vertical configuration secures the second-highest price-weighted electricity yield. Illustrated in Figure 9.
Figure 8 - Electricity production and pricing during the day in these regions. (A) Belgium, (B) Poland, (C) France, and (D) Serbia.
Figure 9 - Price-weighted electricity output in Belgium, Poland, France, and Serbia.
Considering eligible areas for the optimal PV setup agrivoltaics
The analysis investigates APV’s viability and electricity generation potential across Europe using NUTS-2 regional analysis. By assessing land eligibility, we pinpoint suitable areas within countries.
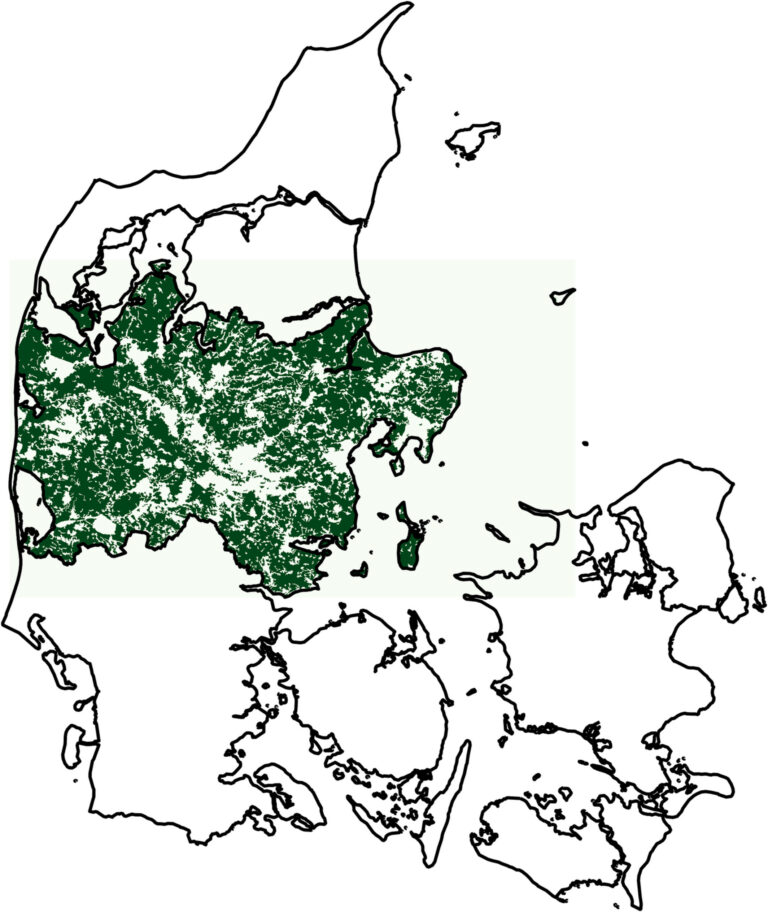
Various land types exist, including artificial surfaces, agriculture, forests, wetlands, and water bodies. Among them, arable land, permanent crops, and pastures are prime for APVs (see Table 1). For instance, in central Denmark (Midtjylland), about 64% of the land is eligible, totaling 8,341 km² (see Figure 10 below).
Figure 10 - Eligible land for APV setups, applying optimal PV setup for agrivoltaics, in Midtjylland (Denmark). This 8341 km² area accounts for 64% of the region's total land.
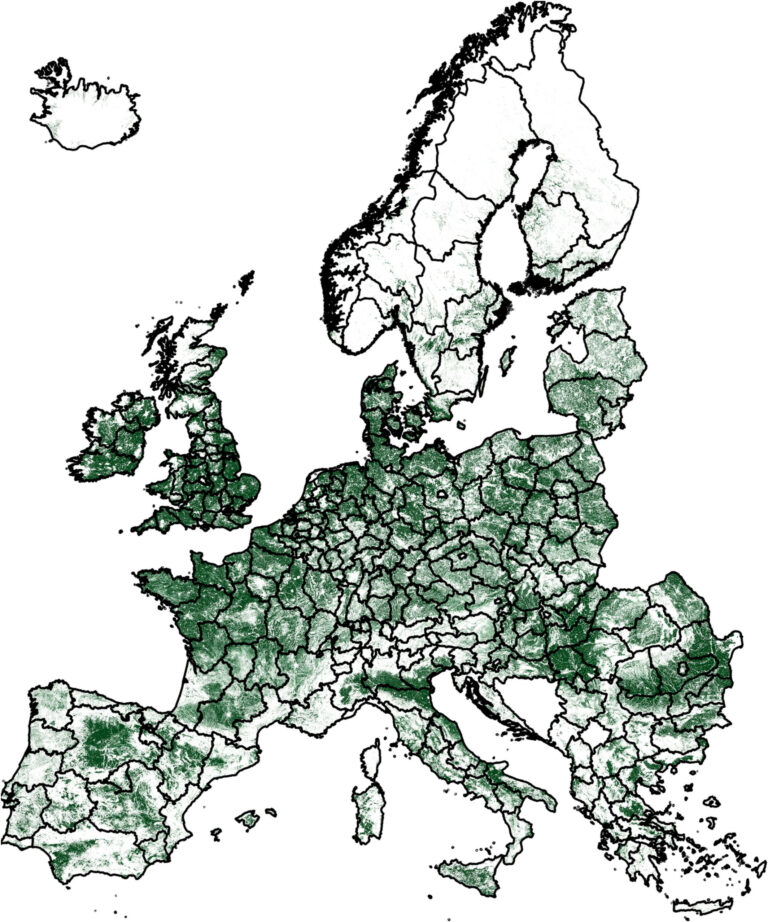
The land eligibility analysis for European APV expansion, using NUT-2 regions (see Figure 11). It represents 16.2% of a total eligible area of 1.7 million km2. The distribution across Europe is uneven, with most countries falling within 12% to 29%. A few have even less (1% to 9%), while some excel, like Hungary (58.6%), Denmark (53.9%), and Ireland (63.9%). Fruit tree areas are valuable for static tilt APV setups as they offer protection from heavy rainfall and hail. In Europe, there’s roughly 29,000 km2 of such land available.
Figure 11 - Viable land for APV installation, applying optimal PV setup for agrivoltaics across NUTS-2 regions. 16.2% of the EU's area, equivalent to 1.7 million km².
These regions constitute 16.2%, totaling 1.7 million km². However, it’s important to note that eligibility varies significantly across Europe. In most European countries we saw the proportion of eligible land ranges from 12% to 29%
What is the capacity potential for agrivoltaics in Europe?
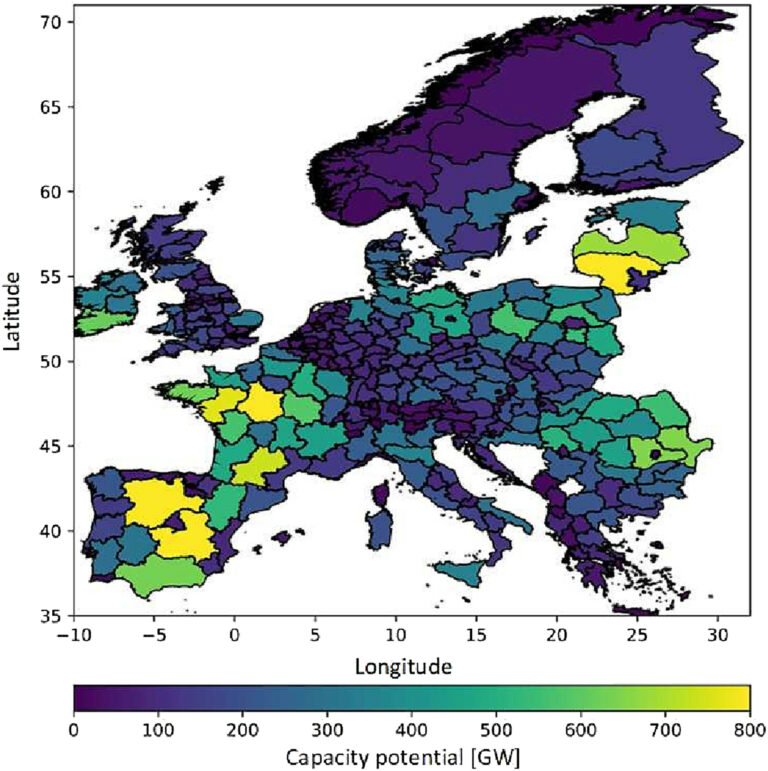
The capacity potential (in GW) for APV across NUTS-2 regions, is found by factoring in the land types detailed in Table 1 and a capacity density of 30 W/m². The southern and eastern regions of Europe exhibit higher suitability for APV systems. This confirms the findings in the analysis, illustrated in Figure 12.
Figure 12 - The highest attainable capacity for APV systems, estimated per NUTS-2 region, factoring in land availability and a 30 W/m2 capacity density for specific land types listed in Table 1.
APV system energy potential (TWh/year) in EU NUTS-2 regions: optimal tilt, vertical bifacial, and horizontal single-axis tracking PV systems is revealed in Figure 13.
Figure 13 - Yearly energy output across various NUTS-2 regions, accounting for a 30 W/m2 capacity density and the agricultural land types specified in Table 1 for (A) optimal tilted, (B) vertical bifacial, and (C) horizontal single-axis tracking setups.
Conclusion: APV configurations and potential for sustainable energy and agriculture
This study delved into diverse agricultural photovoltaic (APV) configurations in Foulum, Denmark, and across European regions categorized by NUTS-2-regions. The research focused on two key aspects: the feasibility of PV systems and their impact on underlying agricultural land. Three distinct APV setups were scrutinized: optimal tilted, horizontal single-axis tracking, and vertical bifacial.
A sophisticated model was devised, accurately simulating shadow effects on solar panels and the ground. This nuanced approach allowed precise analysis of hourly shadow-related production losses for each setup, diverging from generalized loss assumptions. The outcomes affirmed expectations: single-axis tracking yields greater electricity output. However, vertical bifacial setups exhibited superior price-weighted electricity yields in select countries when assessing daily generation patterns.
A 30 W/m2 capacity density is used to assess APV potential in various European NUTS-2 regions. This balances high electricity yields while preserving over 80% of land for crops.
Extending analysis across Europe using the Corine Land Cover database, eligibility areas for APVs were determined, highlighting uneven distribution. Some countries, like Norway, possessed just 1% suitable area, while others, like Denmark, boasted up to 53%.
Overall, APV’s potential shines bright. With a capacity of 51 TW across Europe, it is capable of generating 71,500 TWh/year—25 times the current electricity demand.