

John Fitzgerald Weaver is the Commercial Solar Guy, a mix of politics, physics, economics and evolution, solar power it’s his power too. In this article, he shares the biennial tracking the sun report, document which collects solar data for the past two years, giving us insights on the next ones with regards to installations but also prices. The solar pricing have been decreasing, installations have increased with more efficient modules in the past two years.
Second half covering Berkeley EMP Lab’s Distributed Solar 2020 Data Update, first half covered here…
It is of course, very hard to parse data across hundreds of thousands of installations per year, across varying structure types, weather regions, electricity costs, incentive structures, etc – and come up with salient all encompassing generationzalitons to guide us all on, but there’s one or two.
The biggest reason the price of solar power installations has fallen, is that price of solar power hardware has fallen. Looking at the two charts next two each other below, I think it is safe to draw some hard causations.

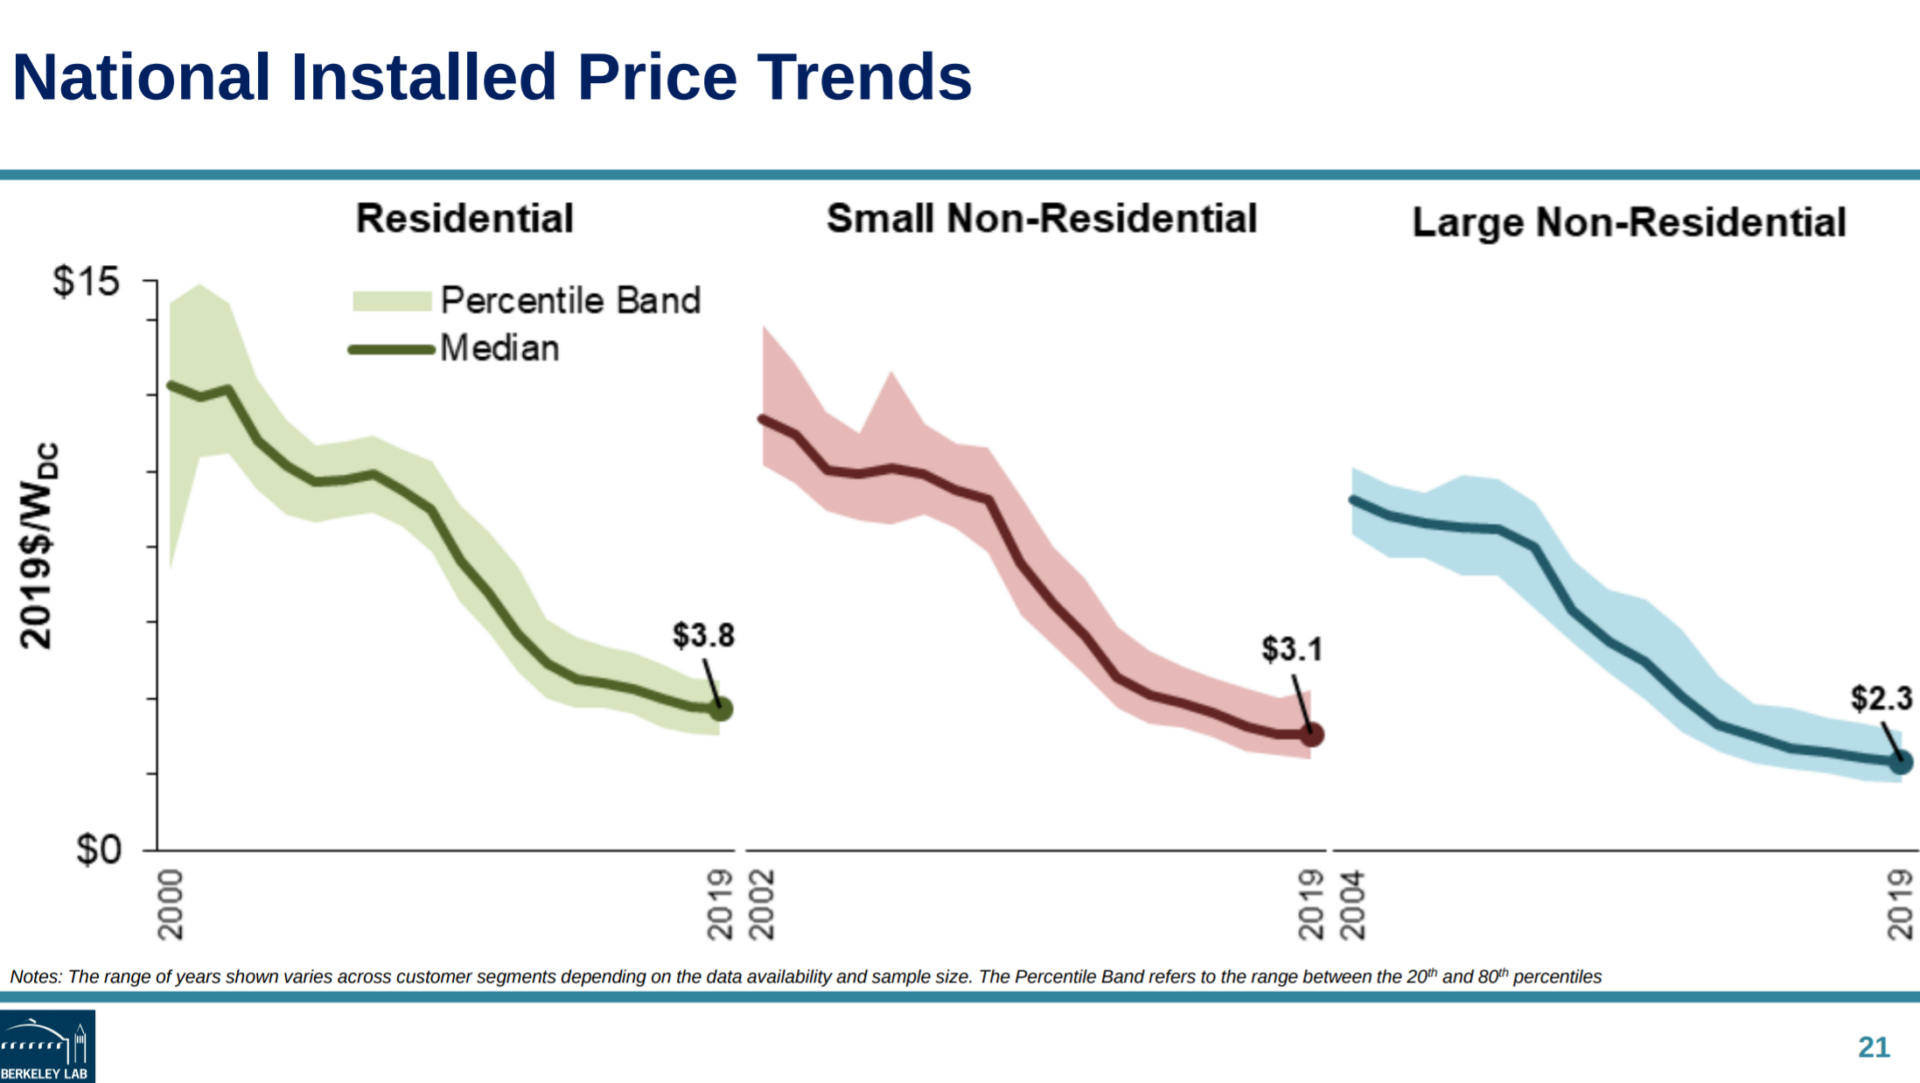
Most of the time, solar panels get the most attention (see me writing about them here, and here, and here, etc). This is the correct place to put you attention. Other components have fallen in price as well though, racking, inverters, as well the engineering, permitting, and other installation labor. Some of this is because modules have gotten more efficient – you can do twice the installation volume, with the same work when this chart began.
System size matters as well. First image below shows system sizes over time. On the residential side, a clear increase – this is due to better panels fitting more solar in a space, but also people installing more because the pricing makes sense. On the commercial side, average size and size range has increased.
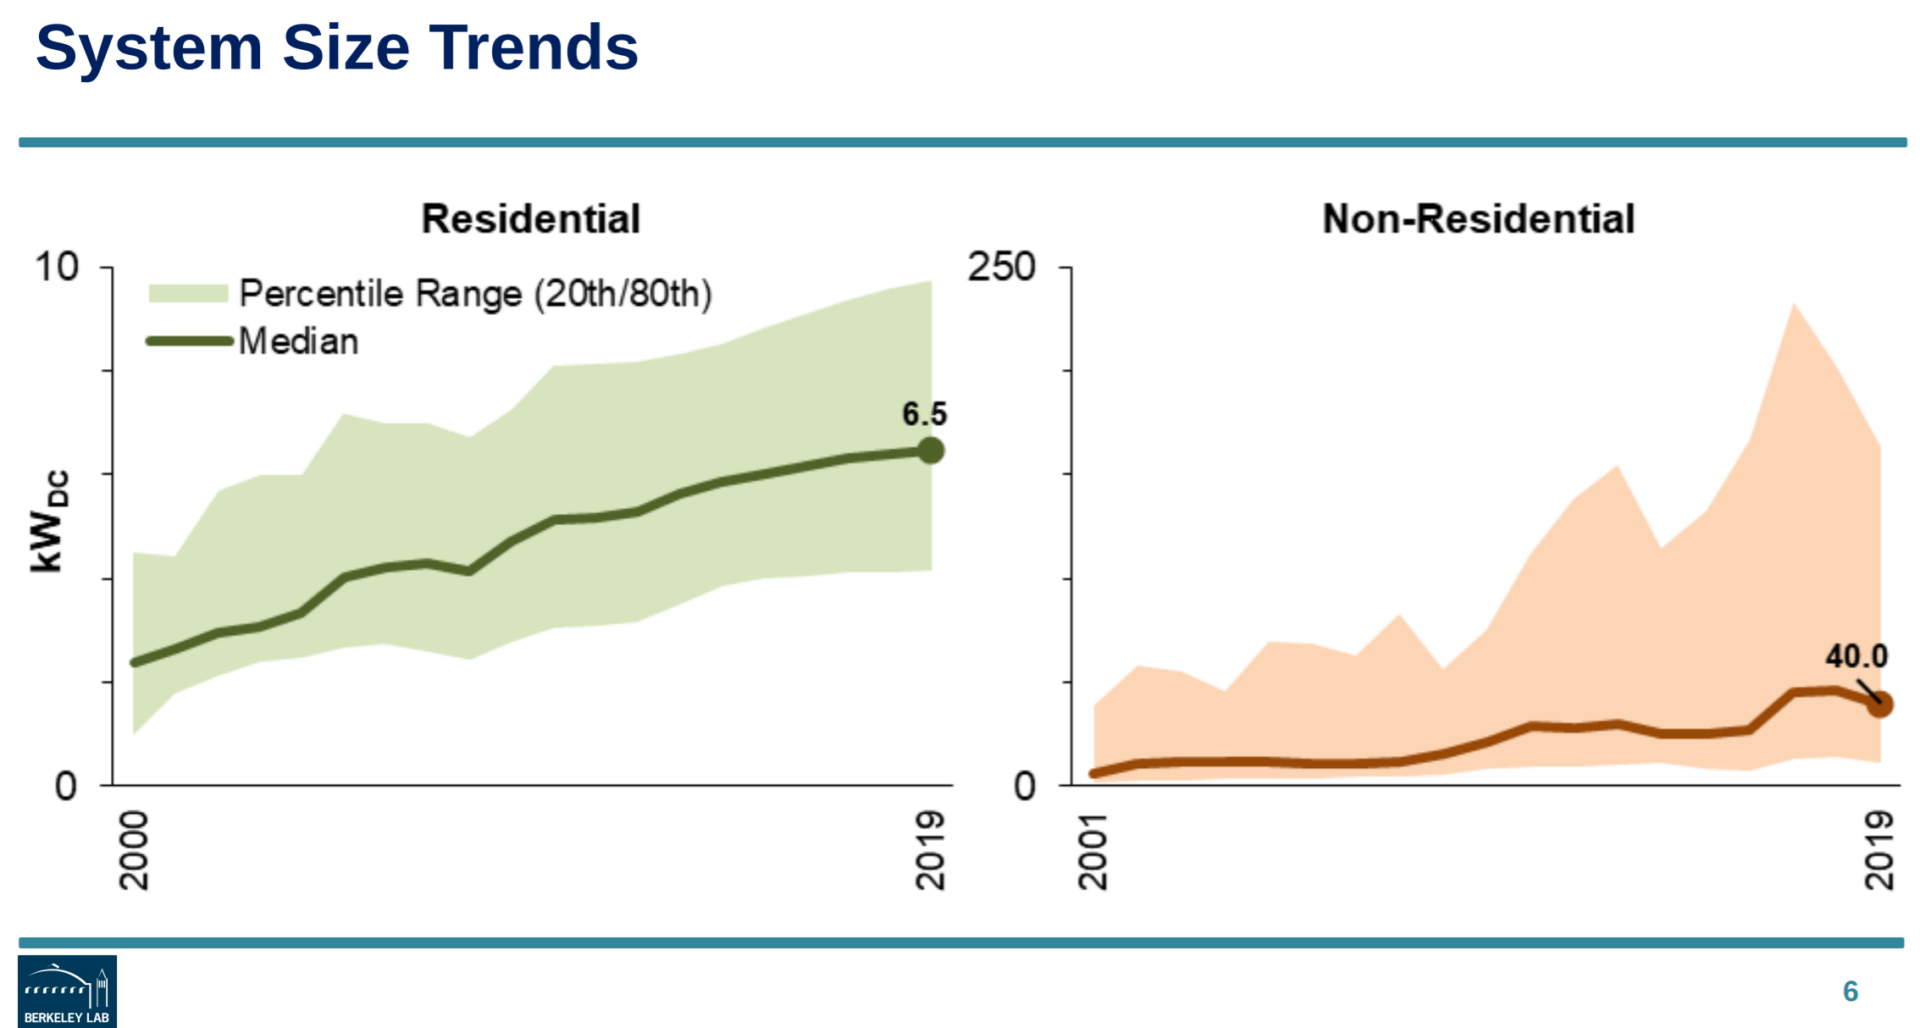
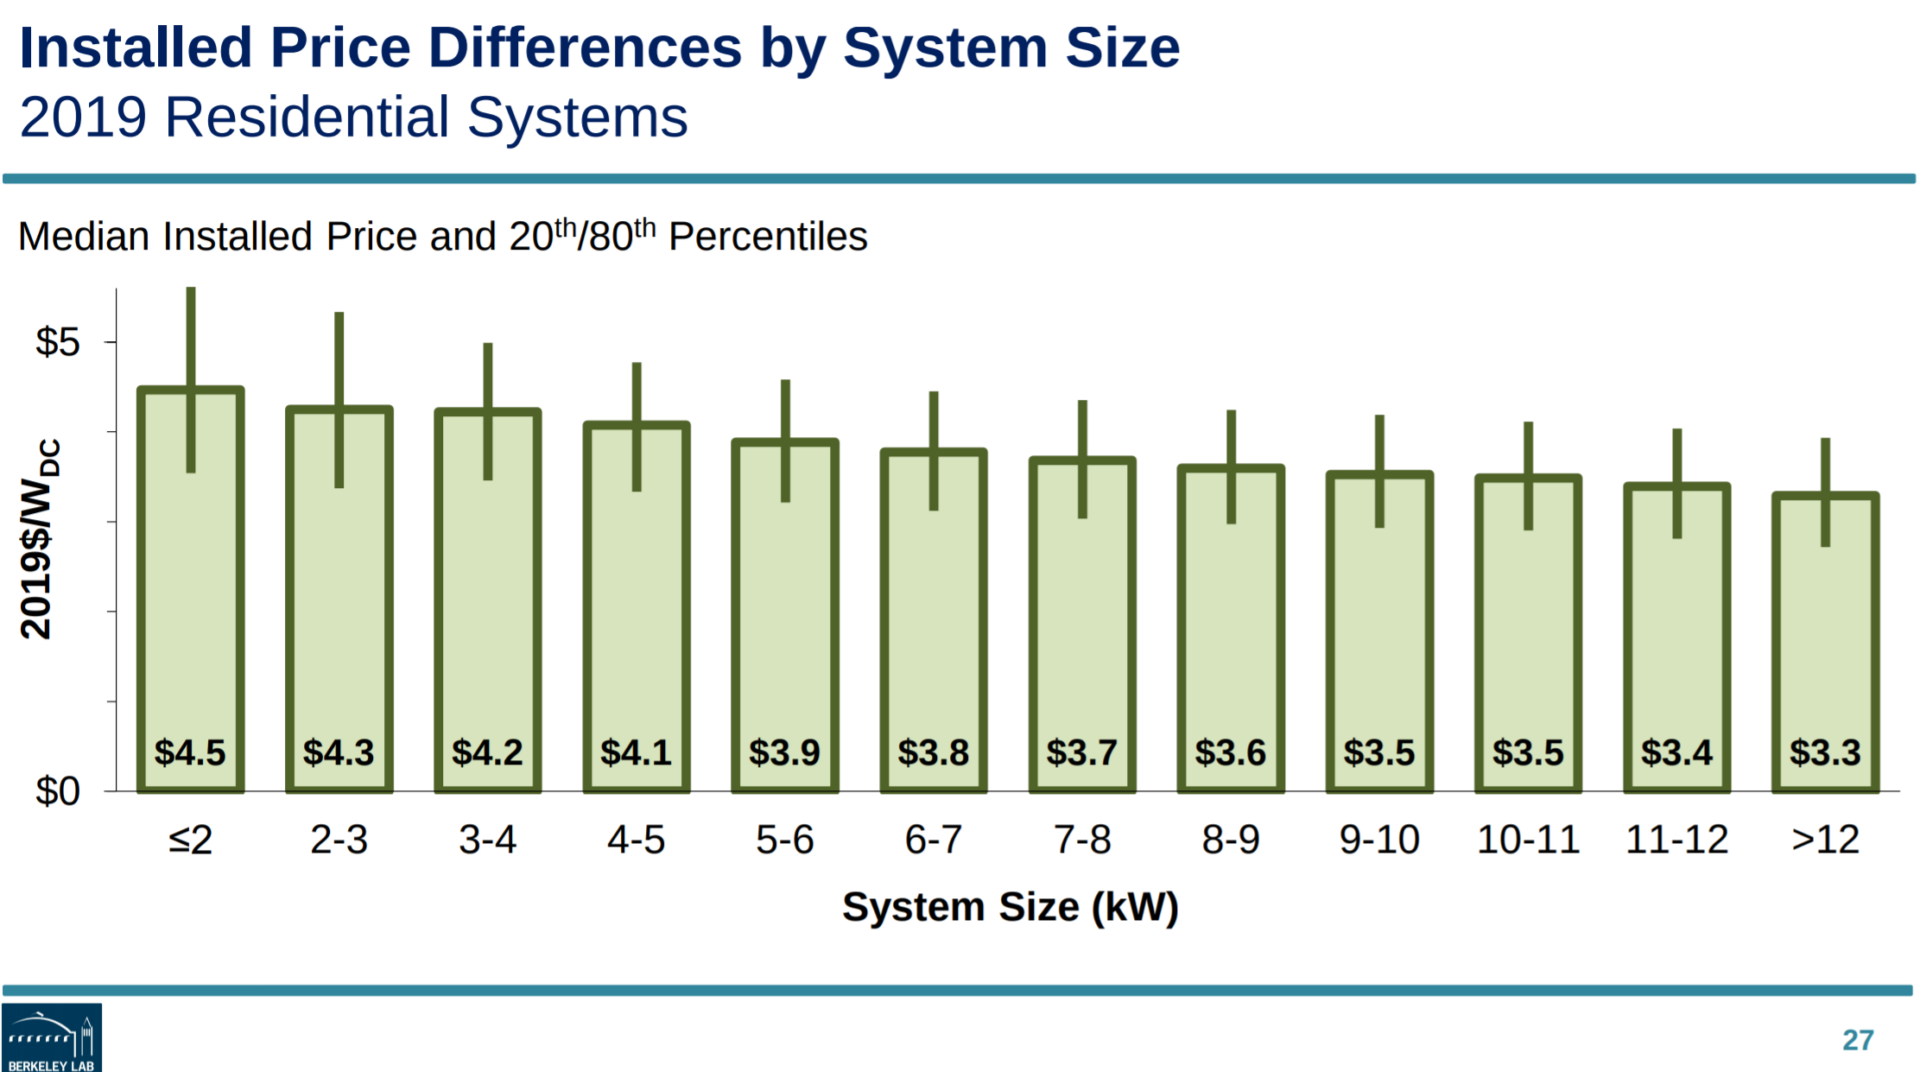

The two images on the right show it simply – larger sized systems cost less. So we combine a general increase in system size, along with the fact that up sizing lower pricing, and we will downward influence the average system price.
These two variables, cheaper components and increasing sizing, over time have pushed solar price downward clearly. Other variables begin to muddle pricing patterns on other levels.
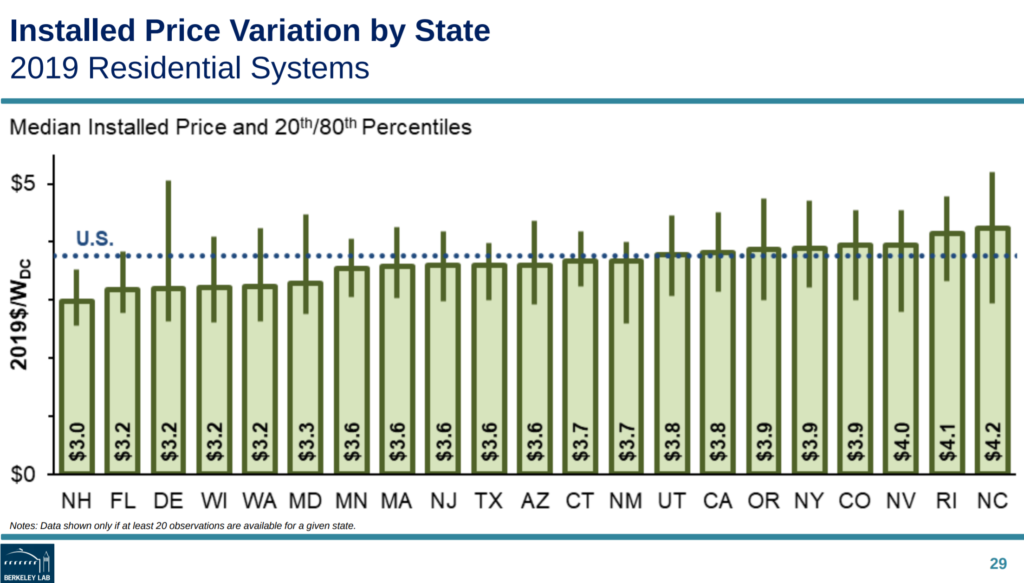
State as a pricing variable – that is mostly a proxy experienced installers, developed supply chains, and competition – is a big driver. Within the state variables, other than learning curves, are differences such as incentives allowing price inflation or driving installation types, licensure dynamics, general labor cost differences and more.

One variable that is strongly driving the cost of residential solar is the cost of finance. Since the incentives are so strong in certain regions, and the marketing teams know how much residential customers are willing to pay, these finance companies price their product perfectly – and strongly. Adding 15-30¢/watt to get instant financing seems to be a cool trade off in the minds of many homeowners.
Truly, as seen below in the left chart, there was a lot of variation in pricing last year across all of the ranges of product types. Yesterday’s coverage noted module efficiency, and whether or not customers installed module level electronics. Above charts show size and state as a reason. And the two below to the right images add in two more variables.
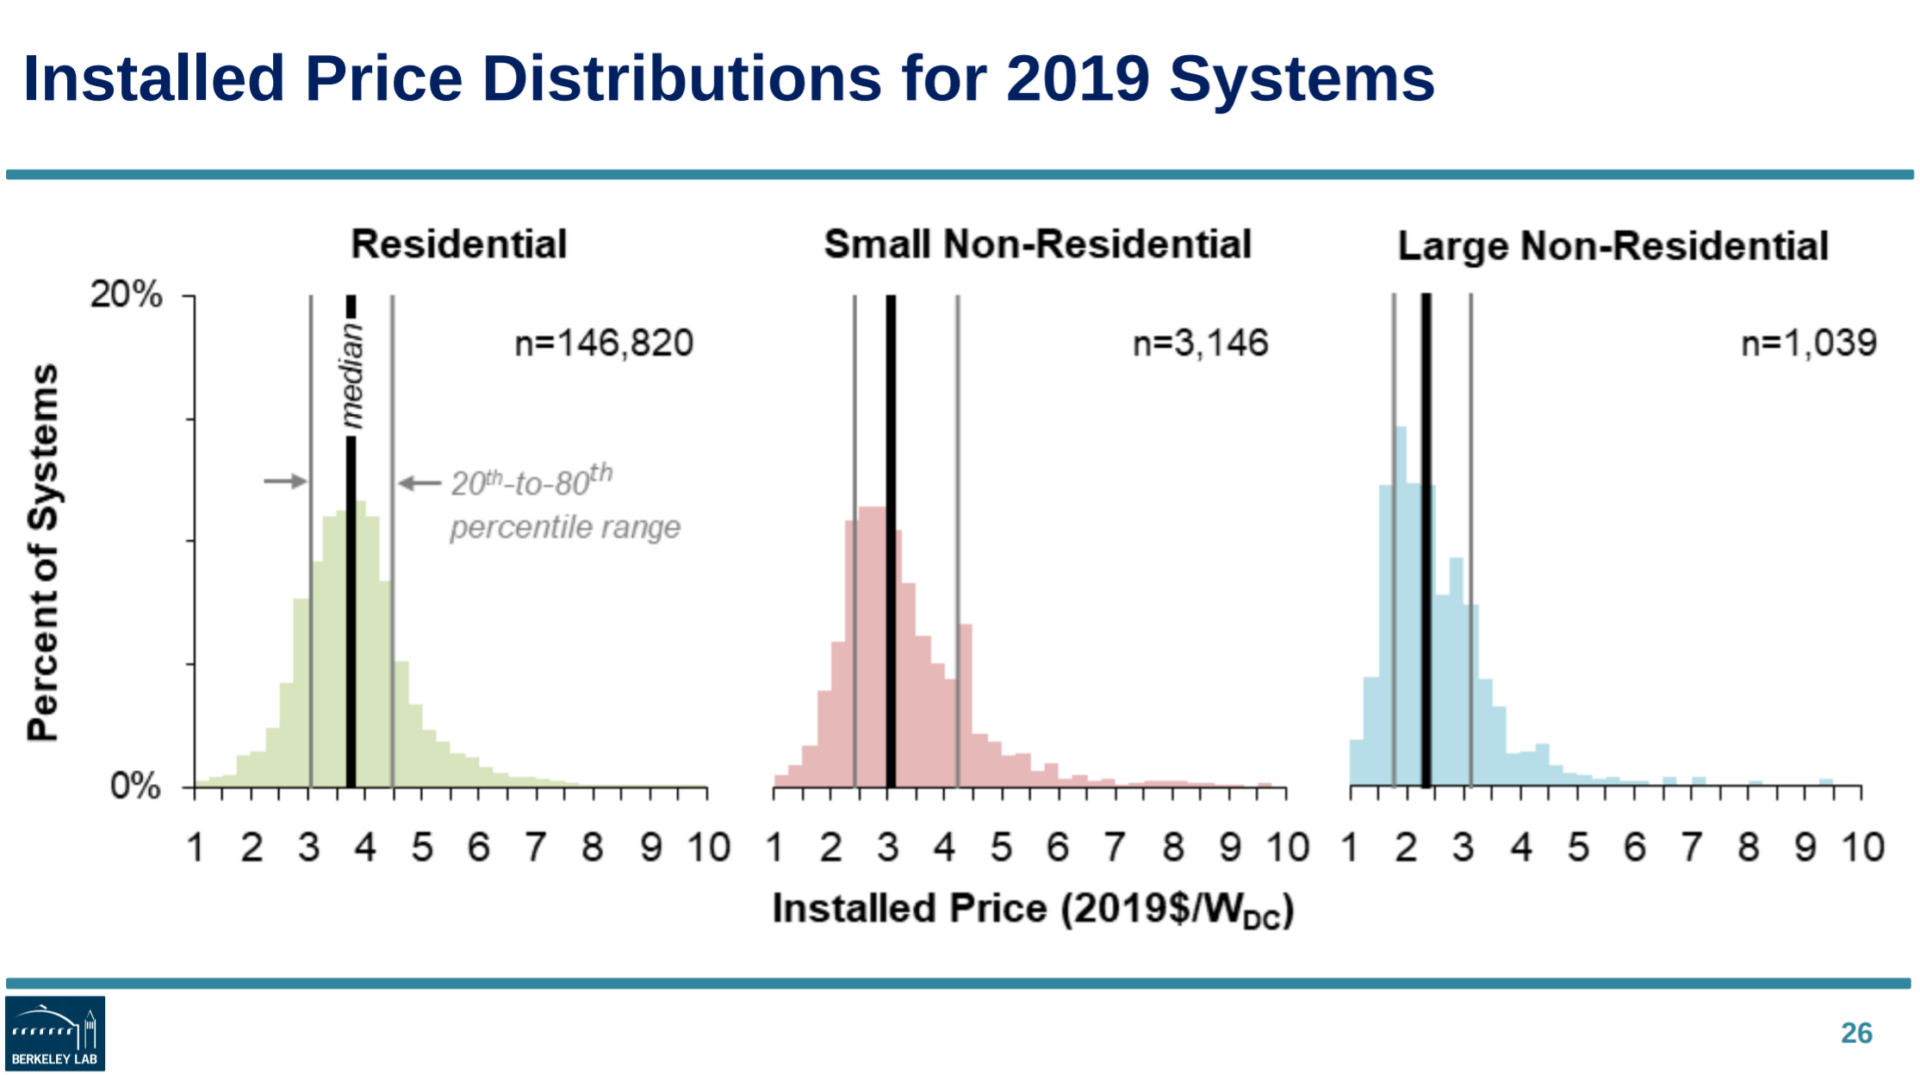
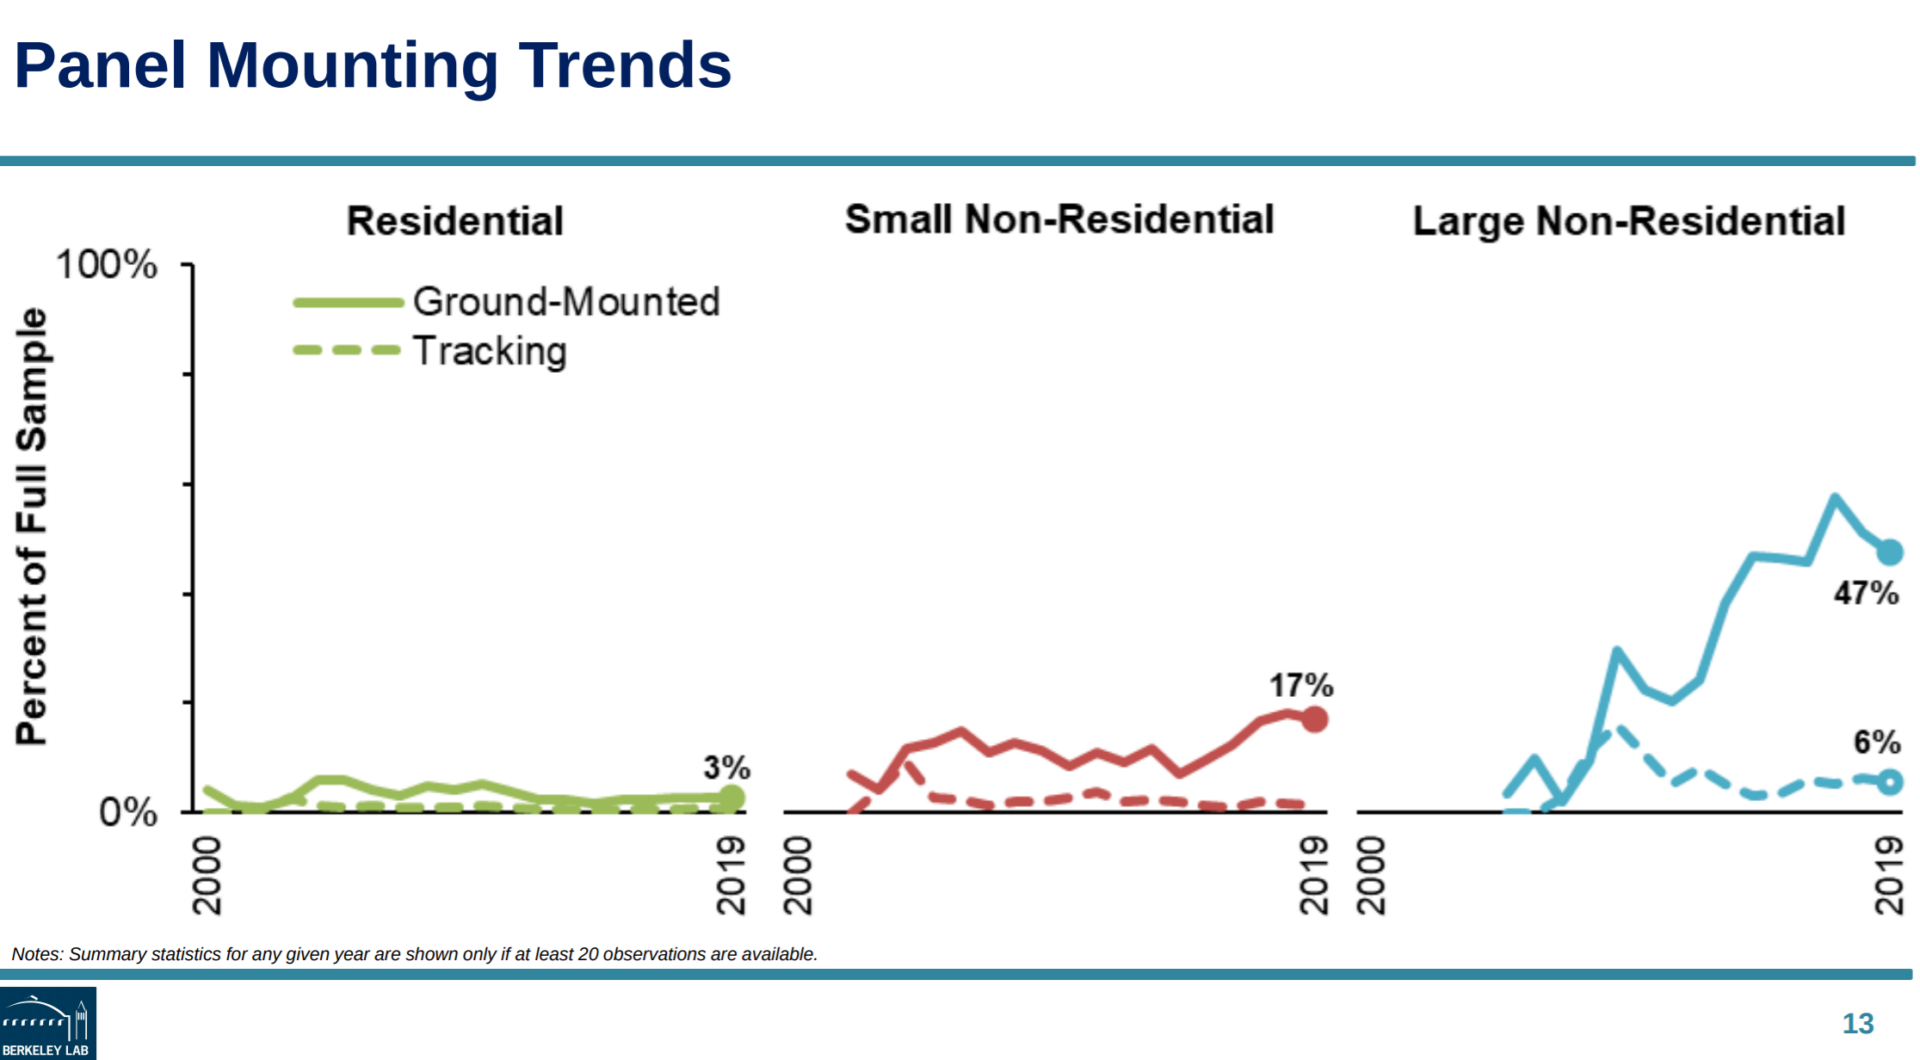
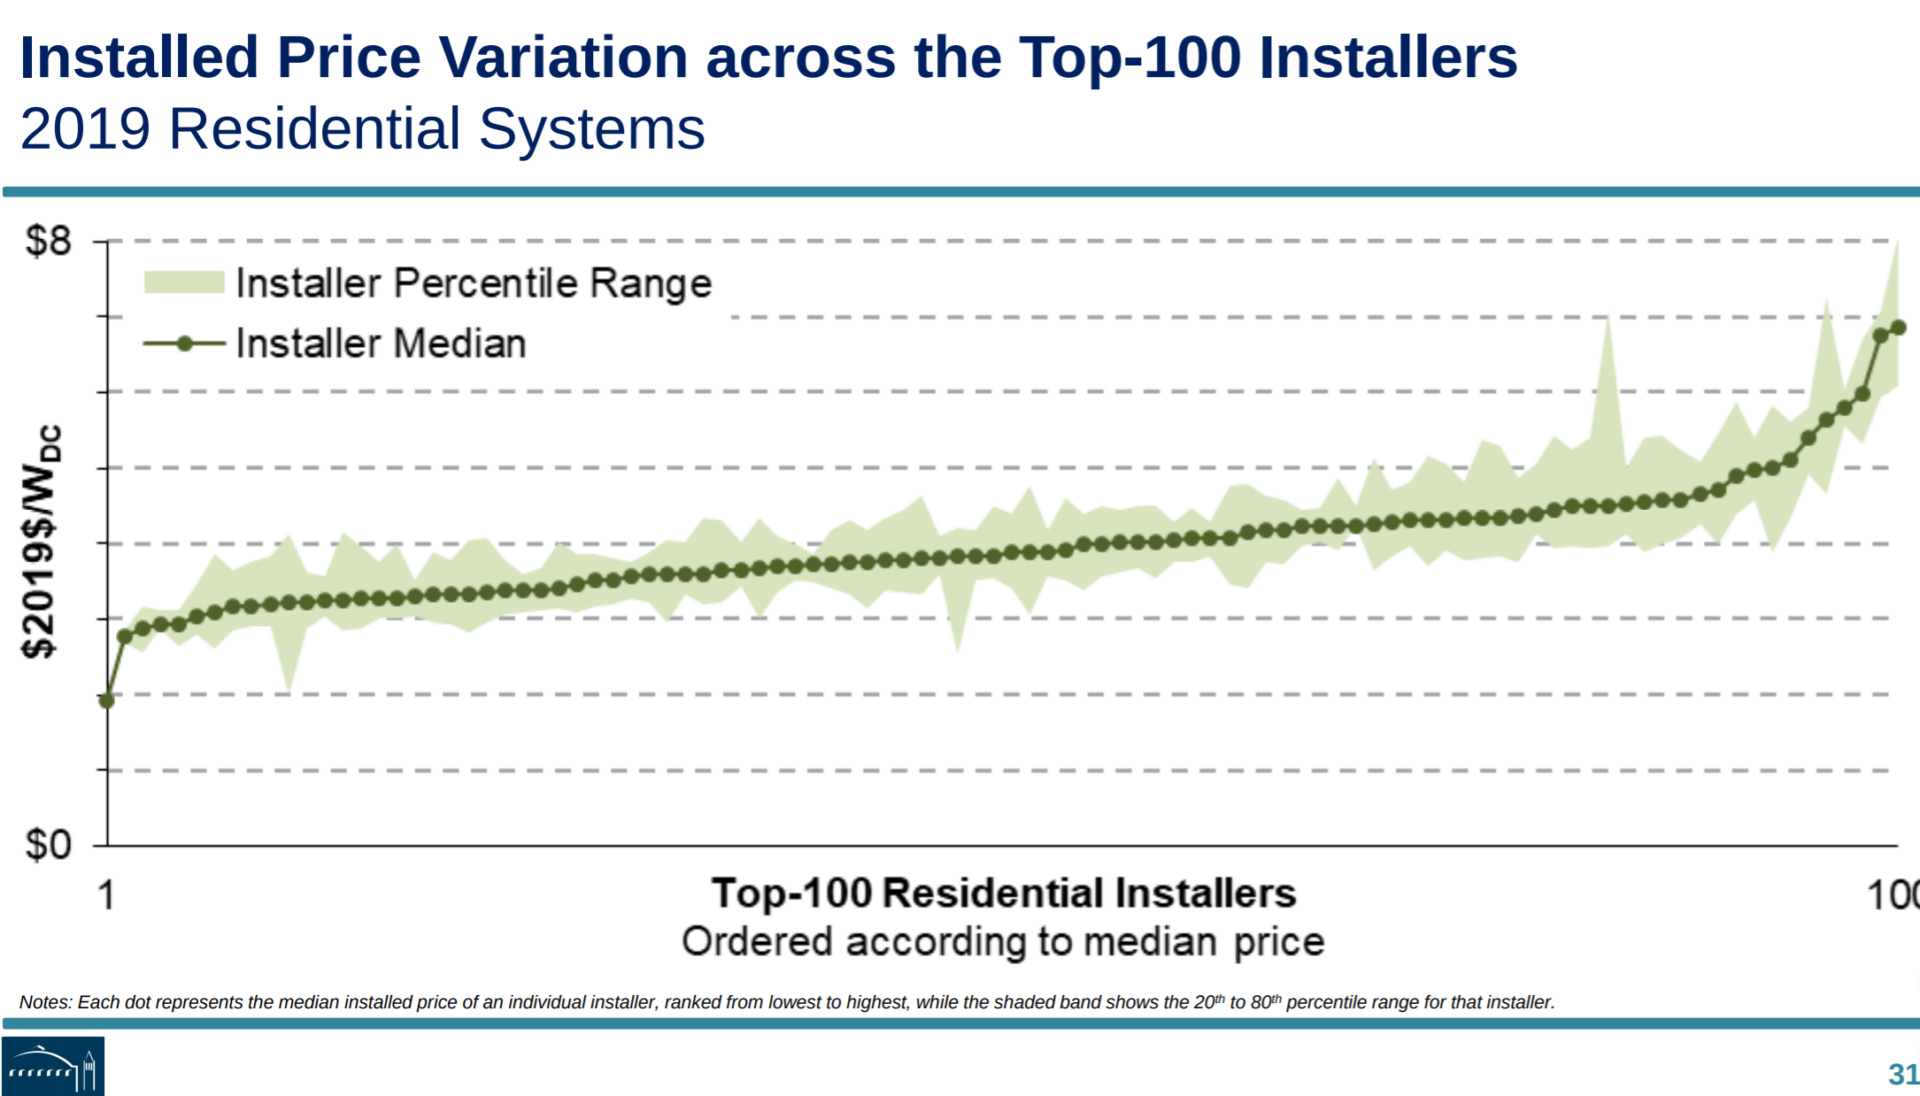
Whether the system is rooftop or ground mount, and what type of ground mount. And then, the installer themselves – which is probably heavily driven by the type of system they install, where they’re located, their experience, and their customer base.
Other pricing variables that CommercialSolarGuy has dealt with in 2020 – upcharge for grid upgrades (transformers, powerlines, substation), structural upgrades, partial roof replacement, upcharge for roofing warranty extension, wind storm damage, covid adder (!!), and a few other items.
All of these variables will affect what you are charged – and what you can charge – for you own projects.
Original Article here
Green Dealflow – is a matchmaker for professional investors and asset owners in the solar and wind industry. You can create a free account and search for assets to invest in, or ask us about off-market projects, find investors for your projects with discretion (off-market), or PPA Off-takers can look for business partners on a “no cure – no pay” basis. Further to this, Green Dealflow delivers news, blog posts and business intelligence, e.g. through a transaction database and monthly reports

")
